
Health Insurance Costs in MI K12 Schools
Health insurance is complex. Managing health insurance expenditures within a school system is also complex. Benefit levels have historically been spelled out in collective bargaining agreements, making it difficult for public school employers and employees to respond nimbly to changing market conditions. Additionally, public school employers historically covered the vast majority of benefit costs, which limited the desire of employee groups to seek savings through plan design changes.
The landscape changed dramatically in 2011 when the Michigan Legislature passed PA 152 of 2011, which capped the amount that public employers in Michigan could spend on employee health insurance. What is “dramatically”? During the 2010-11 school fiscal year (7/1 - 6/30), Michigan LEAs (local education agencies—traditional K12 districts, not public charter schools or intermediate school districts) collectively spent $1.65 billion on employee insurances. During the 2023-24 fiscal year LEAs spent $1.54 billion, meaning insurance expenditures were lower last year than they were 13 years prior (even without adjusting for inflation). This should be an astounding fact to anyone who has even a cursory knowledge of employer health insurance spend.
(As a quick aside, “employee insurances,” “insurance expenditures,” and “health insurance expenditures” are thrown around as interchangeable terms in this post. While they aren’t the same, the statewide data sets that report public school expenditures have only provided sufficient detail to isolate health insurance expense from other employee insurances since 2021. This analysis will go back to 2004, meaning most years include employee insurances—health, life, dental, vision, LTD, etc.—all rolled up into one figure. For reference, however, in the 2023-24 year, about 90 percent of all “employee insurance” spend was attributable to health insurance, which is why the terms are used interchangeably here.)
PA 152 has had a profound impact on health insurance expenditures in Michigan public schools, and very likely kept several districts from insolvency during the period from 2012-2015, when districts were slowly starting to recover from three straight years with no discretionary funding increase followed by a year in which foundation funding was reduced by $470 per pupil. How much has PA 152 saved? The short answer is billions. The full answer is nuanced, and the specific value is unknowable since we will never have the counterfactual.
Let’s investigate a couple of methods of arriving at an estimated figure:
Extrapolating pre-PA 152 insurance spend by a reasonable medical inflation rate
The most rudimentary method of estimating what could have happened in the absence of PA152 is to simply extrapolate the 2010-11 insurance spend forward by using an inflationary figure. If we use 6% compounding on the 2010-11 spend of $1,654,138,655 we get this:
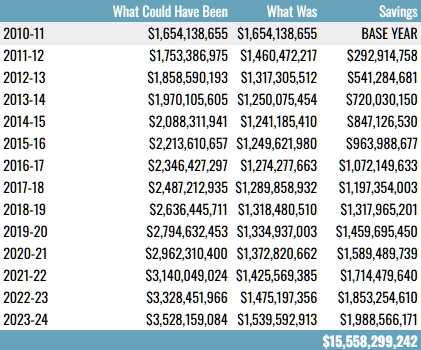
There are three glaring problems with this method. The first is that these increases assume that behavior wouldn’t have eventually changed as costs escalated. Another problem is that we’ve extrapolated from one data point. The less obvious error is that public school employment plummeted during a portion of this period. Total LEA employment was around 176,000 during 2010-11. Employment totals dropped to approximately 158,000 in 2016, before beginning to climb through the remainder of the period analyzed. So gross aggregate spending on insurance wouldn’t have simply increased along with a medical inflation trend. The reduction in covered employees would have offset the increase in the cost of the plans themselves. We need to look at the issue on a cost-per-employee basis.
Extrapolating pre-PA 152 insurance spend per employee by a reasonable medical inflation rate
Instead of using aggregate insurance spend for all LEAs for ALL EMPLOYEES, if we break down insurance costs to the average cost per employee then inflate that figure by 6% per year, we get this:
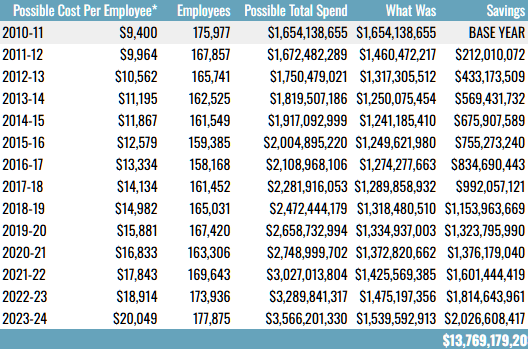
*This table starts with the actual cost per employee for insurance expenditures in 2010-11 ($9,400) and extrapolates that figure forward to arrive at total costs based on actual employment each year.
Now that we’ve corrected for employment levels, what issues remain? We still have the issue with an underlying assumption that behavior wouldn’t change as costs increase. And another weakness of this analysis is that the extrapolation is done from one data point (2010-11 cost per employee) using a medical inflation rate that doesn’t capture choices being made at the individual employee and district level. Instead of using 2010-11 costs in isolation, we could also extrapolate based on a multi-year, pre-PA 152 trendline.
Extrapolating pre-PA 152 insurance spend per employee utilizing a multi-year trend line
It stands to reason that utilizing a multi-year trendline for insurance spend per employee will at least to some degree capture the complexities of nearly 540 LEAs and their nearly 177,000 employees (as of 2023-24) making personal decisions and agreements at the bargaining table. If we trend the actual per-employee insurance costs from 2004-05 through 2010-11, we get this:
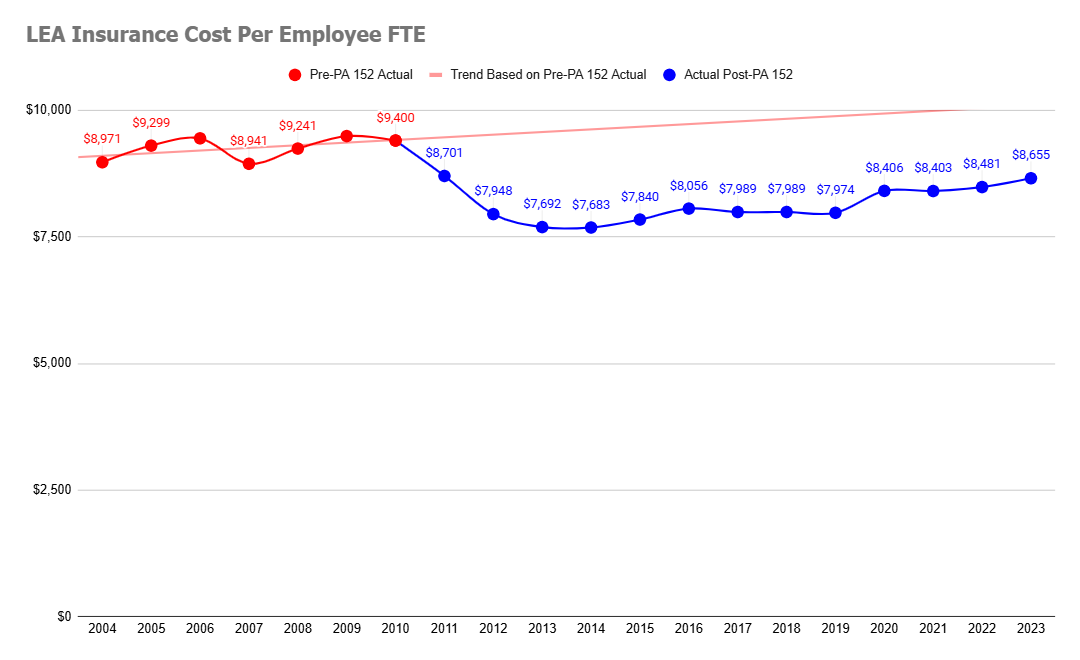
This graph shows expected per-employee insurance costs for Michigan LEAs for 2011-12 through 2023-24 utilizing a trendline developed from actual per-employee costs from 2004-05 through 2010-11. The area between the blue line and the red trendline represents savings at least partially attributable to the impact of PA 152.
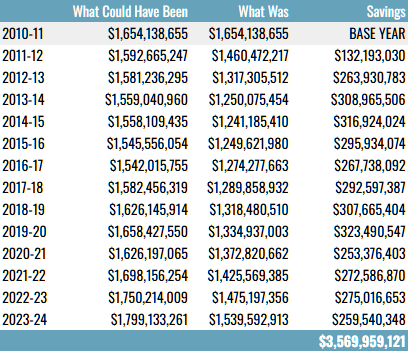
This table shows the dollar savings calculated between expected versus actual LEA insurance costs, with expected costs based on seven fiscal years of actual per-employee insurance cost data.
In summary
No method of analysis is perfect. As stated before, we’ll never know what would have transpired had PA 152 not been adopted in 2011. Behavior would have changed at some point and to some degree. As district budgets were being devoured by rising insurance costs, administrators would have taken firm stands at the bargaining table to preserve dollars for other areas of the budget. Employee groups also would have eventually sought alternative plans as raises dwindled and layoffs became more common. But just because we can’t prove its exact dollar value, it doesn’t mean that we should disregard the impact the legislation has had.
It is fair to say three things:
1) PA 152 expedited changes in insurance consumerism in Michigan LEAs
2) PA 152 shifted the balance of power from employees to public school employers as it pertains to managing health insurance costs
3) PA 152 prevented significant reductions in staffing and student programming by capping runaway health insurance costs
While it was fair to mention the three points above, it is imperative to mention one more:
However many billions of dollars PA 152 has freed up for other uses in district budgets, those billions have become the burden of public employees themselves in the form of increased deductibles, higher copays, higher premium sharing payments, and reduced benefit levels. Some will say, “So what?” Others, however, have felt these changes in very personal ways. As the legislature decides what to do with HB 6058 (which made a number of revisions to PA 152 that would dramatically increase district health insurance costs, reduce budget certainty related to health benefits moving forward, greatly reduce costs for employees, and was approved by the full legislature but never transmitted to the Governor’s office for signature) or a compromise bill, what’s in the balance is too important for this discussion to devolve into political theater. And that is the ability of districts to continue providing students and families with the services they need while also attracting and retaining the employees they must have to provide those very services. Nuance is often lost in political discourse. This issue will have lasting repercussions and hopefully receives the thoughtful debate it deserves, with input from those on all sides of this multifaceted topic.